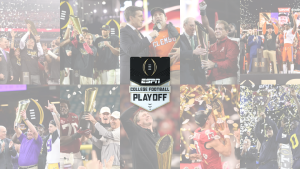
March 19, 2024ESPN and the College Football Playoff Extend Exclusive Media Rights Agreement Through 2031-32 Season Read More
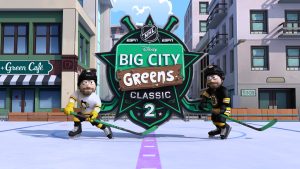
March 8, 2024Disney Advertising Pushes the Boundaries with Brands for Second NHL Big City Greens Classic Alt-Cast Read More
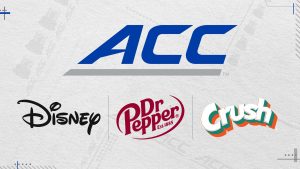
February 28, 2024Disney and ACC “Crush” a New Collaboration – Dr Pepper Named an Official Conference Sponsor Read More
February 7, 2024Disney Earnings Q1 2024: CEO Bob Iger Shares Announcements and Exciting Steps Forward Read More
February 1, 2024Lay’s® and Disney Celebrate Groundhog Day with First-Ever Daylong Timeloop Ad Takeover on ABC Read More
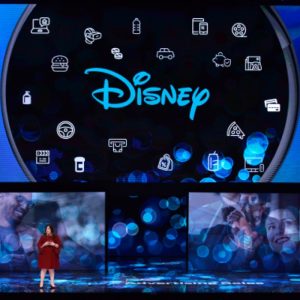
January 10, 2024Disney CEO Bob Iger Opens Company’s Tech And Data Showcase At CES With Video Message Touting Company’s “Century Of Experience” As Execs Unveil New Advertiser Offerings Read More